Practical Tips for Effective A/B Testing of Visuals
Use Quality Testing Tools
To effectively A/B test your images and multimedia, choosing the right tools is crucial. Several tools offer robust features for visual testing, including:
- Google Optimize: Integrates seamlessly with Google Analytics and provides powerful A/B testing and personalization features.
- Optimizely: Known for its user-friendly interface and extensive testing capabilities, including A/B and multivariate testing.
- VWO (Visual Website Optimizer): Offers a comprehensive suite of testing tools, including A/B testing, multivariate testing, and split URL testing.
Tip: Ensure that the tool you choose supports the specific type of multimedia you are testing and integrates well with your existing analytics setup.
Consider the Context of Your Visuals
The context in which your images or multimedia are displayed can significantly impact their effectiveness. Consider the following factors:
- Placement: Test how different placements of visuals (e.g., above the fold, in the middle of the page) affect user engagement.
- Relevance: Ensure that your visuals are contextually relevant to the surrounding content. Test different visuals to see which ones resonate more with your audience in various contexts.
Tip: Use heatmaps and click-tracking tools to analyze how users interact with different visual placements and adjust based on their behavior.
Optimize for Mobile and Desktop
User behavior can vary significantly between mobile and desktop devices. Ensure that your visuals are optimized for both platforms:
- Responsive Design: Make sure your images and multimedia adapt to different screen sizes and resolutions.
- Performance: Optimize file sizes and formats to ensure fast loading times on both mobile and desktop.
Tip: Run separate A/B tests for mobile and desktop versions of your visuals to identify any performance differences and optimize accordingly.
Incorporate Interactive Elements
Interactive elements, such as sliders, quizzes, or clickable infographics, can enhance user engagement. When testing interactive visuals:
- Define Interaction Metrics: Track metrics such as interaction rates, completion rates, and user feedback to assess the effectiveness of interactive elements.
- Test Variations: Experiment with different interactive features and designs to determine which ones drive the most engagement and positive user experiences.
Tip: Use tools like Hotjar or Crazy Egg to analyze user interactions with interactive elements and gather qualitative feedback.
Analyze Competitor Visual Strategies
Analyzing how competitors use visuals can provide valuable insights and inspiration for your own A/B testing efforts:
- Identify Trends: Observe the types of visuals that are common in your industry and evaluate their performance.
- Benchmark Performance: Compare your visual performance against competitors to identify areas for improvement.
Tip: Use competitive analysis tools like SEMrush or Ahrefs to gather data on competitors' visual content strategies and performance.
Iterate and Refine Based on Results
A/B testing is an ongoing process. Use the insights gained from each test to refine your visuals and strategy:
- Implement Changes: Based on test results, update your visuals to incorporate the most effective elements.
- Continuous Testing: Regularly test new visuals and formats to keep your content fresh and aligned with evolving user preferences.
Tip: Establish a testing calendar to schedule regular A/B tests and track the performance of your visual content over time.
Maintain Brand Consistency
While testing different visuals, it’s essential to maintain brand consistency. Ensure that all variations align with your brand’s identity and messaging:
- Brand Guidelines: Adhere to your brand’s color schemes, fonts, and style guidelines in all visual tests.
- Consistency Across Channels: Ensure that visual elements are consistent across different channels and touchpoints to reinforce brand recognition.
Tip: Use a brand style guide to ensure that all visual content remains consistent and aligned with your brand’s overall strategy.
Common Pitfalls to Avoid in Visual A/B Testing
Testing Too Many Variations at Once
Testing too many variations simultaneously can lead to inconclusive results and complicate analysis. Focus on testing a manageable number of variations to ensure clear insights.
Tip: Start with a few key variations and gradually introduce additional elements based on initial results.
Ignoring Statistical Significance
Ensure that your A/B tests reach statistical significance before drawing conclusions. Testing too briefly or with a small sample size can lead to unreliable results.
Tip: Use statistical significance calculators to determine the validity of your test results and avoid making decisions based on inconclusive data.
Neglecting User Experience
While testing visuals, don’t overlook the overall user experience. Ensure that tests do not negatively impact site usability or performance.
Tip: Monitor user feedback and behavior during tests to ensure that changes do not adversely affect the user experience.
Failing to Follow Up on Results
Analyzing test results is only part of the process. Follow up on insights by implementing changes and testing further to continuously improve your visual content.
Tip: Document test findings and action steps to ensure that insights are effectively applied and contribute to ongoing optimization efforts.
Avoiding the use of images and multimedia that are not A/B tested is crucial for optimizing your content and achieving better results. By following a structured testing approach, leveraging data-driven insights, and staying informed about best practices, you can enhance the effectiveness of your visual elements and drive better engagement and conversions.
Remember that A/B testing is an iterative process that requires ongoing refinement and adaptation. By consistently testing and optimizing your visuals, you’ll be better equipped to deliver content that resonates with your audience and achieves your marketing goals.
FAQ: Avoiding the Use of Untested Images and Multimedia
1. What is A/B testing, and why is it important for images and multimedia?
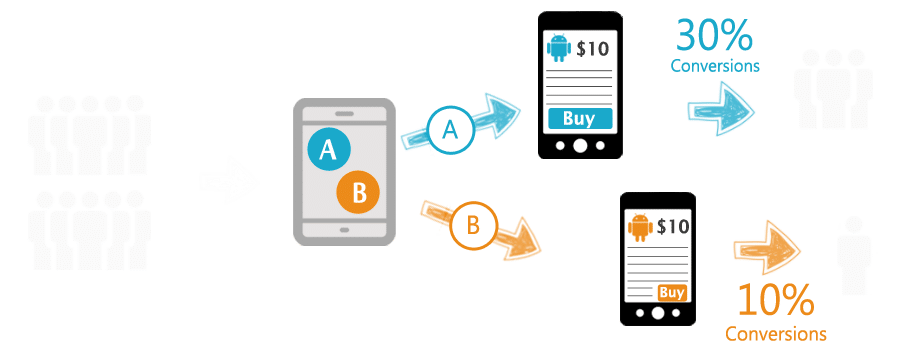
A/B testing is a method where two versions of a visual element (e.g., images, videos) are compared to determine which performs better in achieving a specific goal, like higher engagement or conversion rates. It's important because it allows you to make data-driven decisions, ensuring that your visual content is effective and resonates with your audience.
2. How can I start A/B testing my visual content?
Begin by defining clear objectives for what you want to achieve with your visuals, such as increased click-through rates or improved user engagement. Next, create different variations of your visual content and use A/B testing tools like Google Optimize or Optimizely to compare their performance. Finally, analyze the results and implement the best-performing visuals.
3. What are some common metrics to track when A/B testing visuals?
Common metrics include:
- Click-Through Rate (CTR): Measures how often users click on a visual or call-to-action.
- Conversion Rate: Tracks how many users take a desired action (e.g., signing up, purchasing) after interacting with a visual.
- Engagement Rate: Looks at how long users interact with multimedia, such as watching a video or engaging with interactive content.
4. How can I ensure that my visuals are optimized for both mobile and desktop users?
Use responsive design to ensure that your images and multimedia adapt to different screen sizes and resolutions. Additionally, test visual performance separately on mobile and desktop platforms to identify any discrepancies and optimize accordingly.
5. What tools are recommended for A/B testing visual content?
Popular tools include:
- Google Optimize: Ideal for integration with Google Analytics and A/B testing of visuals.
- Optimizely: Offers extensive testing capabilities, including multivariate testing.
- VWO (Visual Website Optimizer): Provides a comprehensive suite of tools for A/B testing, heatmaps, and session recordings.
6. Can I test more than just images in A/B testing?
Yes! A/B testing can be applied to various forms of multimedia, including videos, infographics, interactive elements, and even different layouts or designs of visual content.
7. What is multivariate testing, and how does it differ from A/B testing?
Multivariate testing evaluates multiple elements simultaneously (e.g., images, headlines, and CTAs) to see how they interact and which combination performs best. It provides a more comprehensive analysis compared to A/B testing, which only compares two versions of a single element.
8. What should I do if the A/B test results are inconclusive?
If your results are inconclusive, consider extending the duration of the test to gather more data, or refine the variations you are testing to highlight differences more clearly. Ensure that your sample size is large enough to reach statistical significance.
9. How often should I conduct A/B tests on my visual content?
A/B testing should be an ongoing process. Regularly test new visuals, especially when launching new campaigns or updating your website, to keep your content optimized and aligned with user preferences.
10. How can I maintain brand consistency while testing different visuals?
Adhere to your brand's style guidelines, including color schemes, fonts, and overall design language. Even as you test different visuals, ensure that each variation aligns with your brand identity to maintain consistency across all channels.
Get in Touch
Website – https://www.webinfomatrix.com
Mobile - +91 9212306116
Whatsapp – https://call.whatsapp.com/voice/9rqVJyqSNMhpdFkKPZGYKj
Skype – shalabh.mishra
Telegram – shalabhmishra
Email - info@webinfomatrix.com


.jpg)


